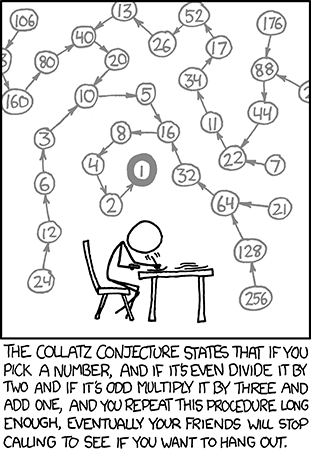
Of course I recognized the graph right away. I never heard it described as Collatz Conjecture before, but this concept also makes an appearance in my very favorite book of all time, Godel, Escher, Bach. In a dialogue between Achilles and the Tortoise, they were referred to as "Wondrous Numbers," and Wikipedia confirms that both terms are acceptable.
After reading the cartoon, I started doodling my own graphs, which -- despite the convulted twistiness of Randall's picture -- are essentially binary trees, going downward from one. If you draw the left branches as multiplying by two, and the right branches as "minus one divided by three", then you may get a graph like this:
1
|
2
|
4
|
8
|
16
|...\
32...5
|....|
64...10
... and so on.
The tree is easy to generate. Of course, it's an infinitely large tree, so you have to decide which nodes to expand. The two main ways I can see to do it are:
1. Start with 1, balance the depth by always expanding the leaves that are at the least distance from the origin.
2. Start with 1, always expand the leaves that have the smallest numerical value.
So for example, in the tree above, I've used method 1. If I had used method 2, I would have needed to add 5, 10, 20, 3, 6, 12, 24,and 40 to the tree before I could expand node 32.
Now, obviously this tree gets large in the vertical direction faster than the horizontal direction at first; later on, when the branches increase exponentially, the opposite is be true. But when I tried sketching the graphs, I was annoyed by all the white space at the top. I thought the tree would look much neater if I started with the root in the upper left corner and tried to push the left nodes downward, and the right nodes rightward. So the above graph would be changed to something like this:
1...5--10--3--6--12--24
|../../
2.|.20
|.|.|
4.|.40
|.|
8.|
|/
16
|
32
|
64
and so on like that, giving me more space to expand toward the bottom right. (Hope that's clear.)
Once I was able to sketch this, I started writing it as a program, but currently haven't finished working out the algorithm to decide where in the grid to place each node. Basically the requirements are as follows:
1. You should be able to display any binary tree with this program (it doesn't have to be tied to Wondrous Numbers).
2. Root is displayed in the upper left corner.
3. Prefer to display children to the right of and below the parent, as much as possible.
4. The algorithm should eventually fill up all available space in a specified grid size.
5. The nodes should be as tightly packed as possible, avoiding empty spots.
6. Parents and children should be connected by straight lines, which do not cross. Failing that, fewer crossed lines is preferred.
I thought of a few different ways to accomplish these goals, but haven't been able to decide which one to focus on first. My first thought was just to place new nodes anywhere nearby, and then gradually move them out of the way as necessary when adding new nodes. This would require me to decide which nodes need to be moved, based on either position in the tree or position on the grid.
I also thought I might go with a hill climbing algorithm, where I just keep swapping nodes at random until the number of line intersections is decreased. However, I don't much like this solution, because calculating all possible intersections repeatedly could eat up more processing time than I like.
That's about as far as I've gotten. Any thoughts?
Of interest may be a recent StackOverflow round of Code Golf also inspired by the same cartoon.
ReplyDeleteI submitted my own solution, though not nearly as clever as some others.
You might want to consider an H-Tree based mapping from a binary tree to the grid: http://en.wikipedia.org/wiki/H_tree
ReplyDeleteIn the layout below, down or right is "times two", and is indicated by dashed lines. Up or left is "minus one, divided by three" and is indicated with dotted lines.
It looks a lot better in a fixed-width font (Not sure how to do that in a blogspot reply... if its possible... so I made a pastebin link: http://pastebin.com/n4h9NAee which should have the correct formatting.)
For example:
1
2--4
| 3----6
| : 12--------24
| : 48----96
| 5----10
| : | 13--------26
| : | : 17...52---104
| : 20---40
| : | 53---106
| : 80-------160
| : 320---640
8--16
| 21---42
| : 84-------168
| : 336---672
32---64
| 85-------170
| : 113..340---680
128--256
| 341---682
512-------1024
2048--4096
[/code]
I made this with a quick python script.
For a denser tree, it fills in the full grid more densely.. Consider a full binary tree:
126..62--125 122..60--121 110..54--109 106..52--105
30.......14-------29 26.......12-------25
124..61--123 : 120..59--119 108..53--107 : 104..51--103
6.................2----------------5
118..58--117 | 114..56--113 : 102..50--101 | 98..48---97
28.......13-------27 : 24.......11-------23
116..57--115 112..55--111 : 100..49---99 96..47---95
0
94..46---93 90..44---89 | 78..38---77 74..36---73
22.......10-------21 | 18.......8--------17
92..45---91 : 88..43---87 | 76..37---75 : 72..35---71
4.................1----------------3
86..42---85 | 82..40---81 70..34---69 | 66..32---65
20.......9--------19 16.......7--------15
84..41---83 80..39---79 68..33---67 64..31---63
Having read about H Trees now, that looks like a clever solution, but I need more information. How exactly did you decide where to put numbers in the first graph?
ReplyDeleteOf course there are still a lot of blank spaces in the graph. I'm wondering if it would be possible to scoot some of those numbers up and left in order to make a tighter graph.
I'm happy to send you the python code for it if you like... but I can probably describe it pretty cleanly here:
ReplyDeleteI start out with a bounded plane, ranging from -1 to 1, and place values on that plane using rational-numbered coordinates recursively.
Every level of the recursion alternates its branching direction (left/right vs up/down), and we also keep track of a horizontal and vertical "child offset". (Both start at 1/2). How they are used will hopefully be clear in the example below... I hope :-)
The first (root, value = 1) point is placed at (0, 0). It is an even numbered level, so it uses Up/Down branching (using the "vertical child offset, which is 1/2). Which to say that its children are placed at the parent's position with y +- 1/2 . There is no "right" at the first level, so it only goes "down" from the root. We also divide the "vertical offset" by 2, so it is now 1/4.
The second point (value = 2) goes at (0, 1/2), it uses horizontal branching (the horizontal offset is still 1/2), so its children are placed at the parents position with x +- 1/2. Again.. no "right child", so we only go one direction (right in this case), and update the horizontal branching factor by dividing by 2.
(Aside: The "left children" are drawn below, or to the right of the parent, and the "right children" are drawn above or to the left of the parent. I know the left-right swap is confusing, but you wanted "1" to be in the upper left corner... so...)
The third point (value = 4) is placed at (1/2, 1/2), uses vertical branching (vertical offset is 1/4 now). Only one child..
The fourth point (value = 8) is placed at (1/2, 3/4 ( = 1/2 + 1/4)), uses horizontal branching (horizontal offset is 1/4 now). Only one child..
The fifth point (value = 16) is placed at (3/4, 3/4), uses vertical branching, and has both children.. so they go at (3/4, 7/8) and (3/4, 5/8) respectively..
etc, etc.
The final rendering of the screen is done afterwards, and collapses the grid so that no space is reserved for coordinates that are not used. I.e., the rational numbers used in the coordinates do not translate directly to a position on the screen, but are only used to indicate the ordering of the points. This means that the grid is not to scale. In particular, only the positive coordinates exist in this tree... so '1' ends up in the upper left corner, instead of in the center, where its coordinates actually are (the other 3 quadrants disappear).
ReplyDeleteLikewise, nothing appears inside the box defined by the corners (0,0) and (1/2, 1/2). According to the coordinates, it would occupy a quarter of the positive-positive quadrant, but because it is empty, it really only appears in the extreme upper left corner (1, 2, and 4 are placed at its boundaries).
As the code runs, it prints out the positions where it places the points. Here is the output of the "depth = 9" version. You can see the depth-first recursion working here too. In order, it does "self" then "left subtree", then "right subtree":
0/1 0/1 = 1
0/1 1/2 = 2
1/2 1/2 = 4
1/2 3/4 = 8
3/4 3/4 = 16
3/4 7/8 = 32
7/8 7/8 = 64
7/8 15/16 = 128
15/16 15/16 = 256
15/16 31/32 = 512
15/16 29/32 = 85
7/8 13/16 = 21
15/16 13/16 = 42
15/16 27/32 = 84
3/4 5/8 = 5
7/8 5/8 = 10
7/8 11/16 = 20
15/16 11/16 = 40
15/16 23/32 = 80
15/16 21/32 = 13
7/8 9/16 = 3
15/16 9/16 = 6
15/16 19/32 = 12
The way I draw the lines is pretty much a nasty hack... It just records the endpoints of each segment, and which character should be drawn for the line (one of: "|-:."), etc.. and then draws them on the grid before rendering it. That part is ugly, but arguably less important.
Let me know if you want to take a peek at the code. (But no making fun of the line-drawing part, which is awful), or let me know if I wasn't clear in the description above.. or have other questions.
You're right though... because the "top" of the tree being represented is so sparse, the upper left is a bit empty. (It was a lot worse before I collapsed the empty bits of the graph).
I'd imagine that you could probably do better with some more traditional graph layout algorithms... I initially toyed with the idea of just punting on the question, and just spewing out a graphviz "dot" file, and use dot (or one of the other layout algorithms in the graphviz package) to do the layout and rendering into a png or something, but that seemed like it was not really in the spirit of your puzzle. All it does is make the layout algorithm "someone else's problem". :-)
I'd like to think that there would be a nicer heuristic that (while perhaps not providing the same thoroughness) would be more computationally efficient.... but for the life of me I can't think of a better way.
ReplyDeleteAs for Hofstadter's big-golden-book (ie. G.E.& B.) yay for another fan: it's the book that got me into the A.I. field professionally! :-)